We teamed up with CASM Tech [Centre for the Analysis of Social Media] to conduct a pilot study of online conspiracy discourse in Estonia. An interactive dashboard is available here.
Chapter 2: Mapping Conspiracy Theories in the European Online Information Environment
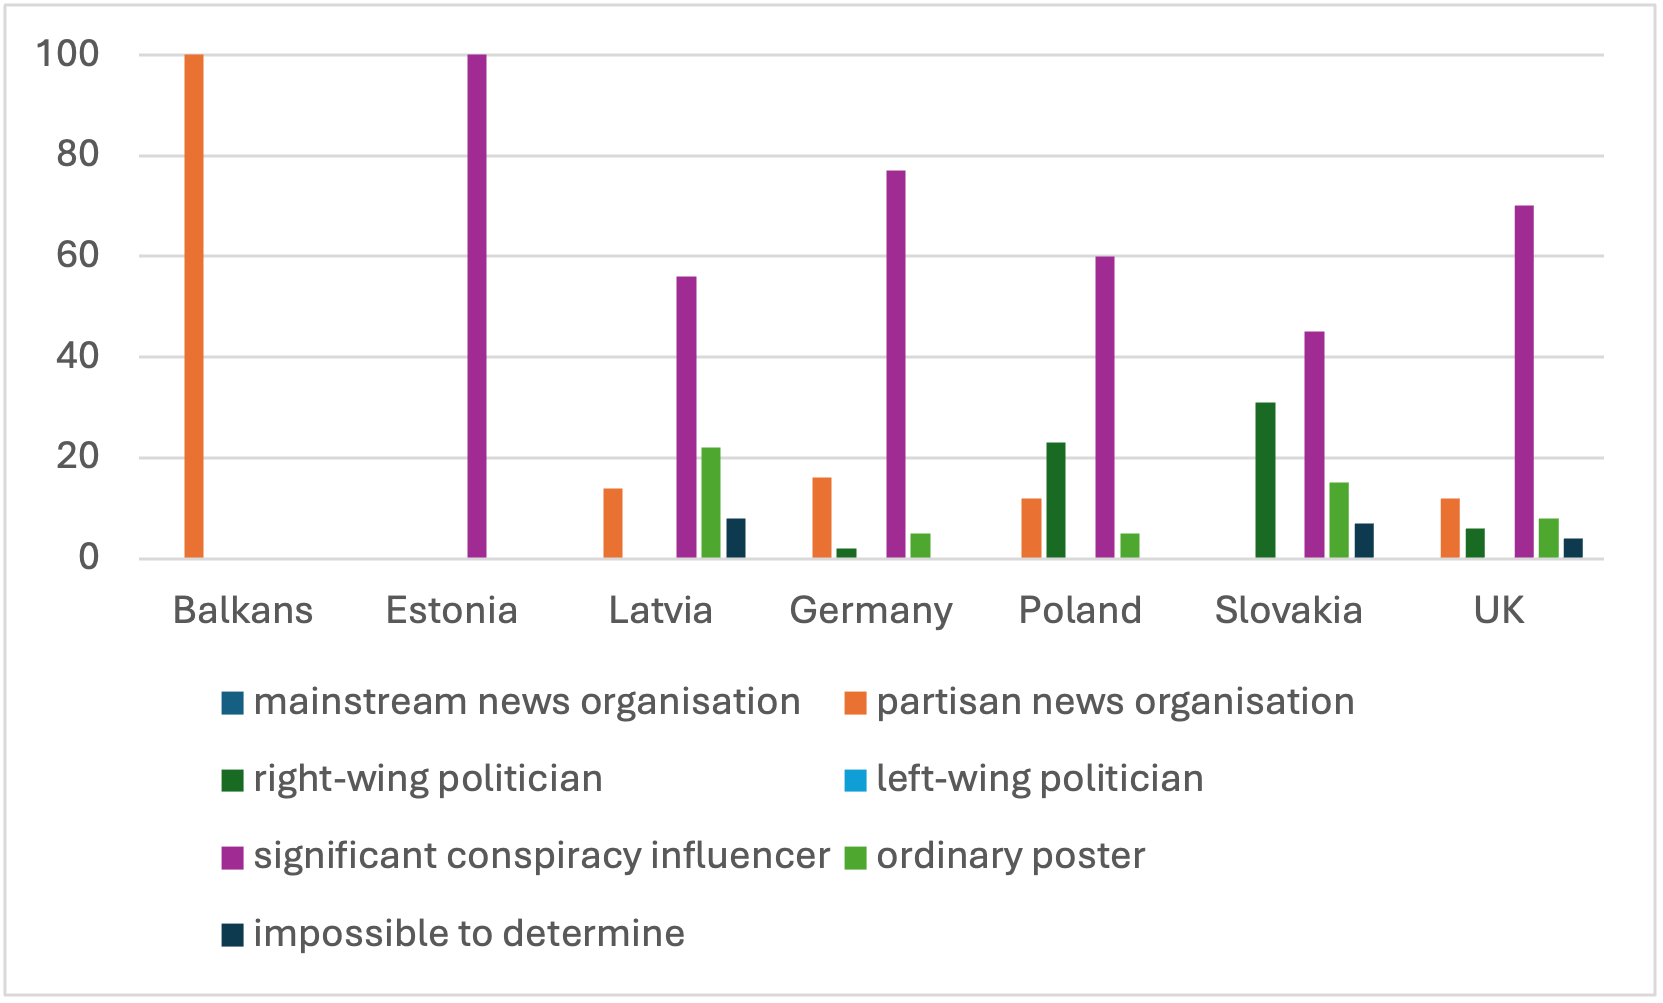
Figure 2.1 Comparison of account type for Covid conspiracy theories on Telegram.
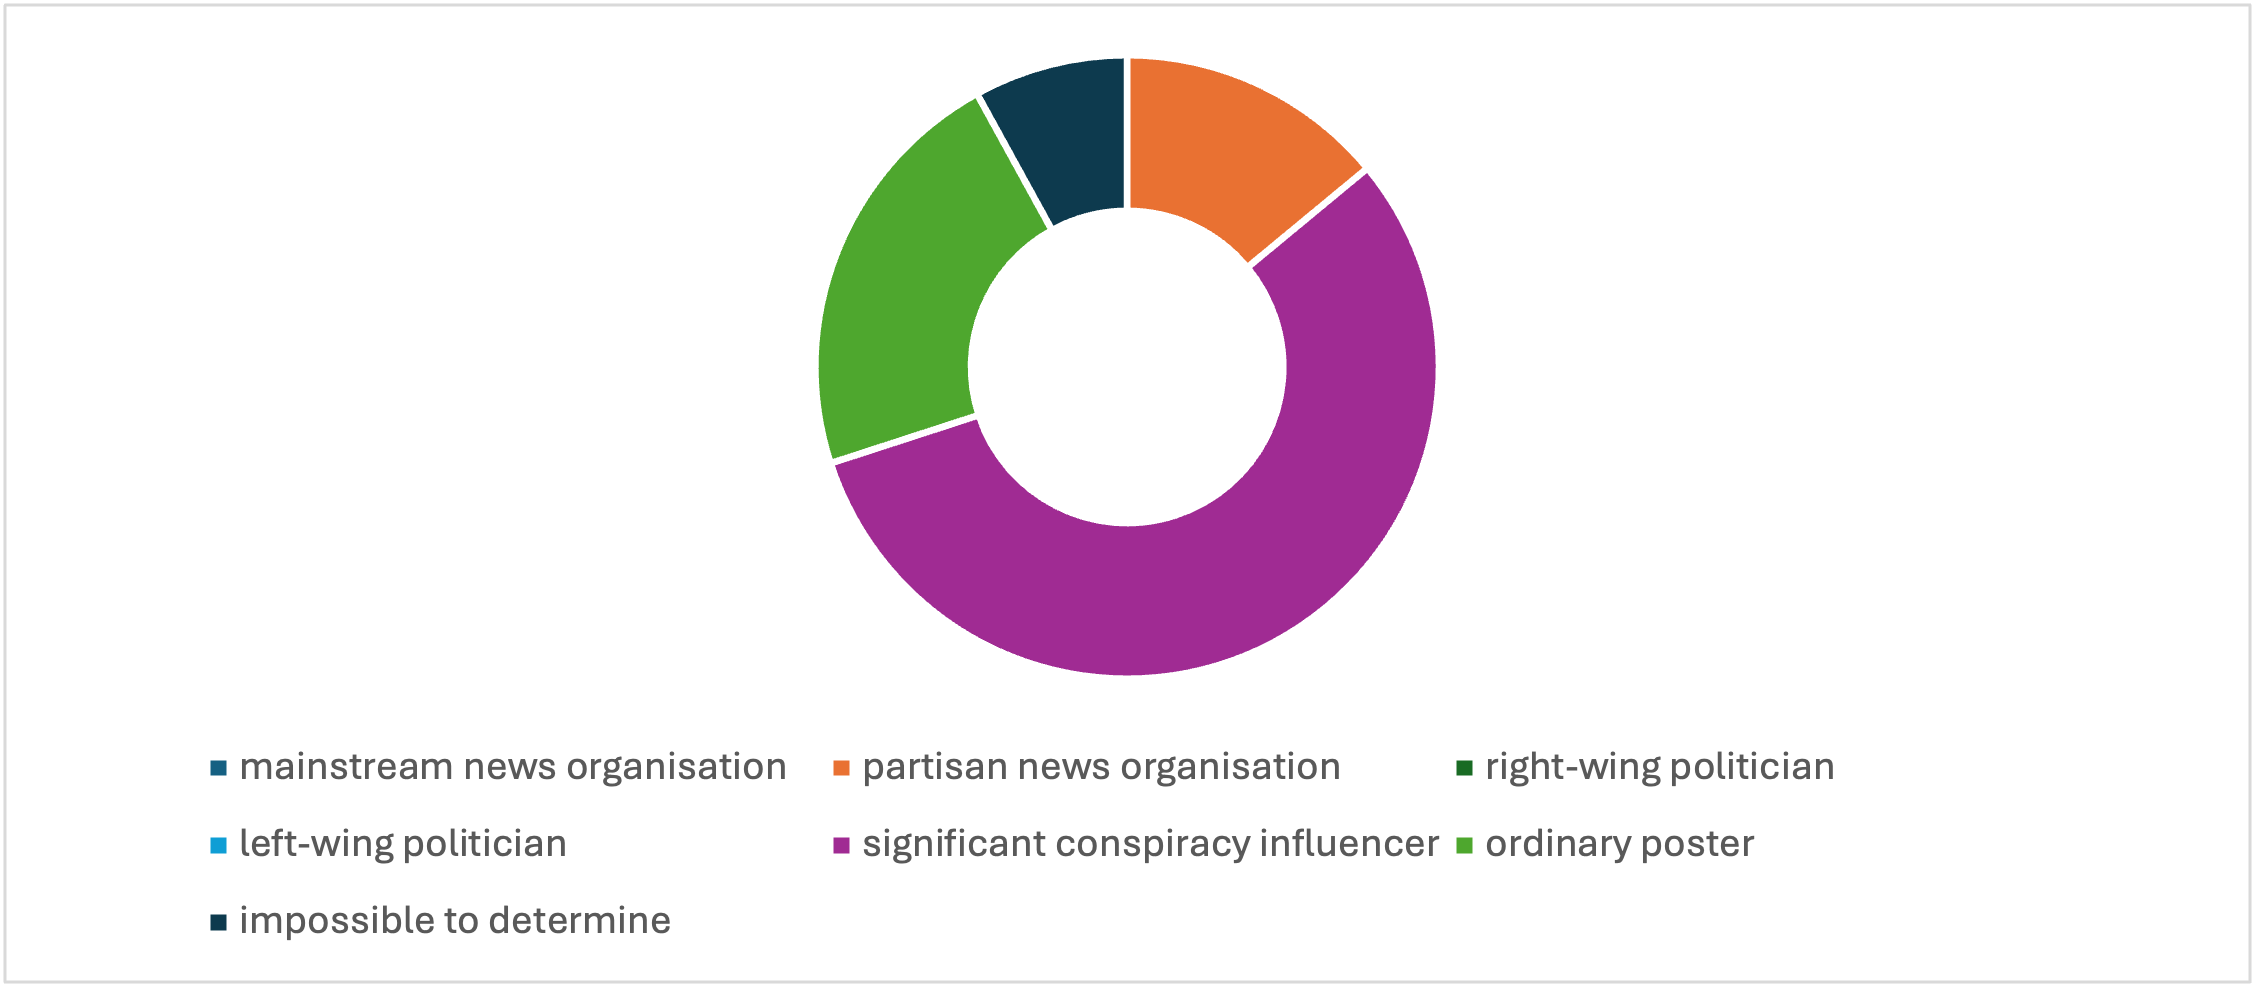
Figure 2.2 Account type distribution for Covid conspiracy theories in Latvia on Telegram.
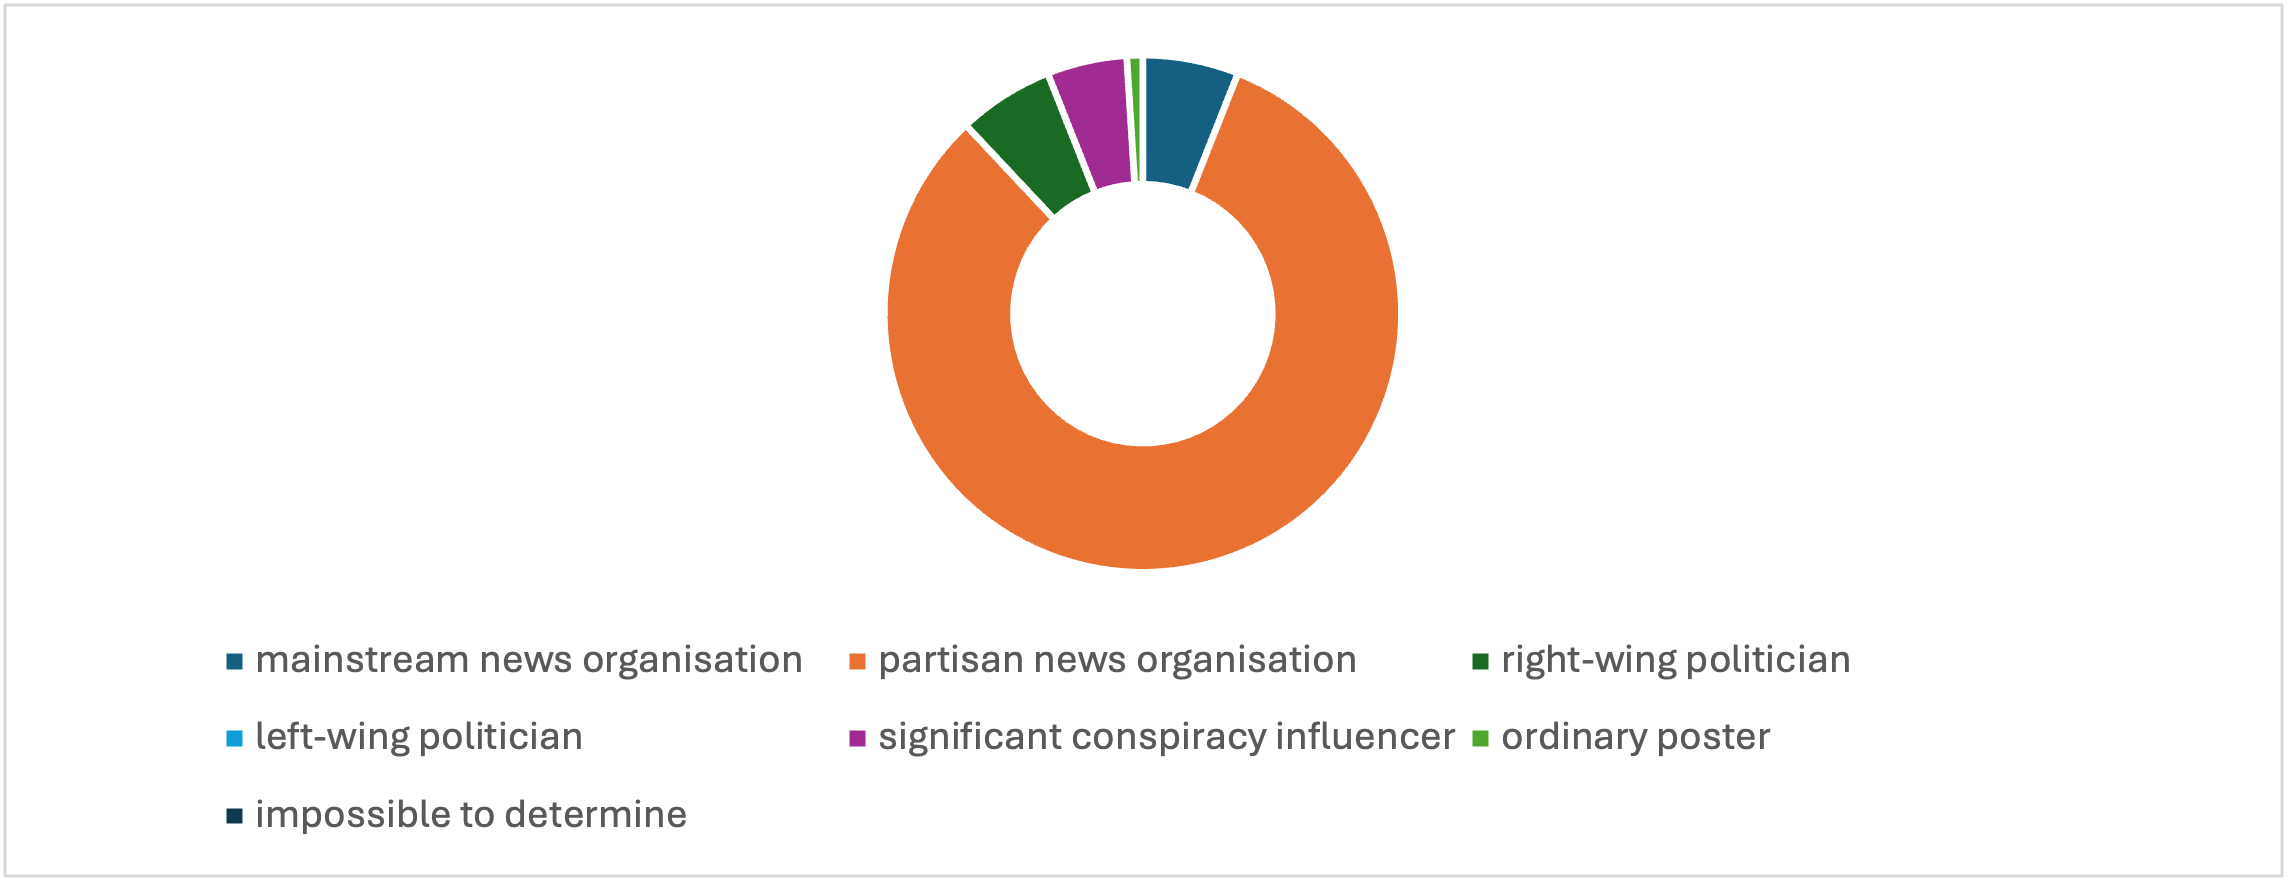
Figure 2.3 Account type distribution for Covid conspiracy theories in Latvia on Facebook.
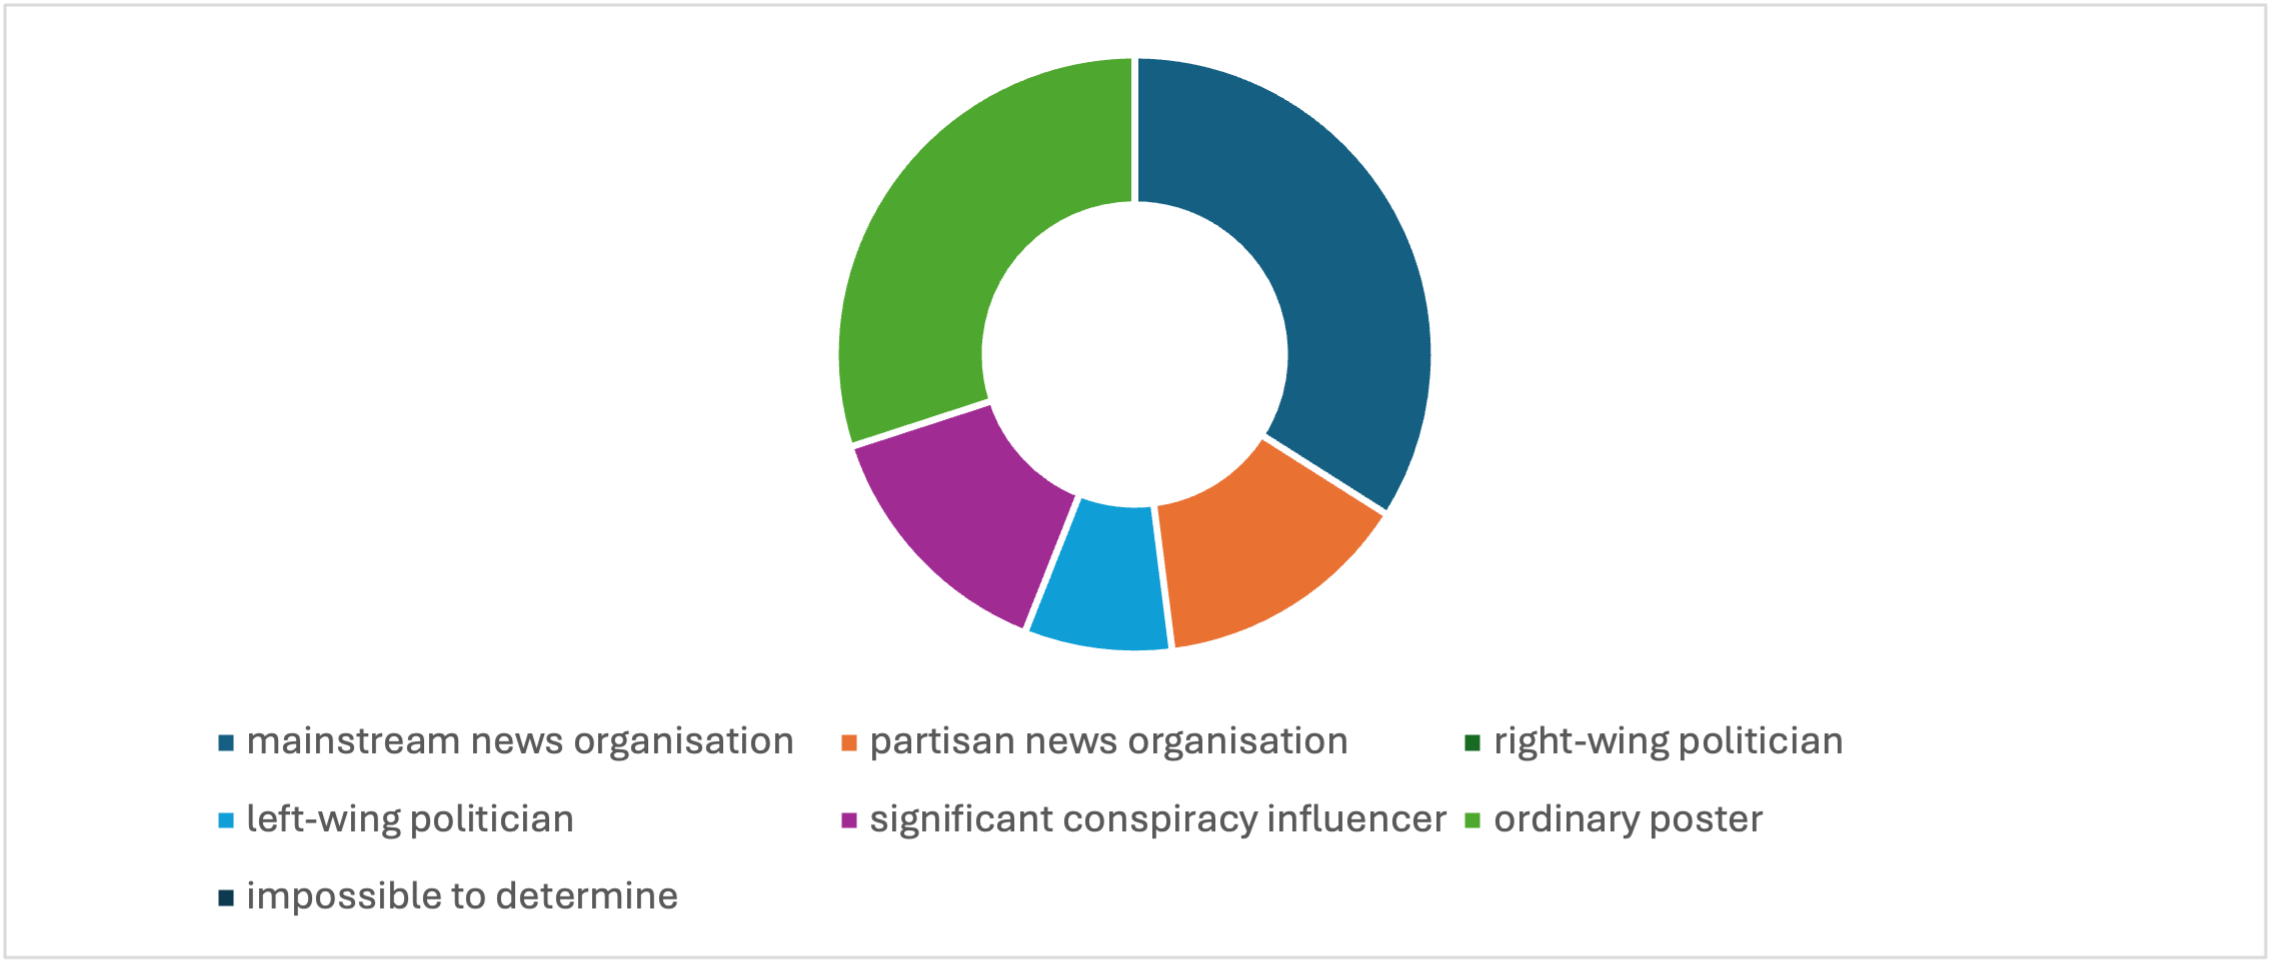
Figure 2.4 Account type distribution for Covid conspiracy theories in the UK on Facebook.
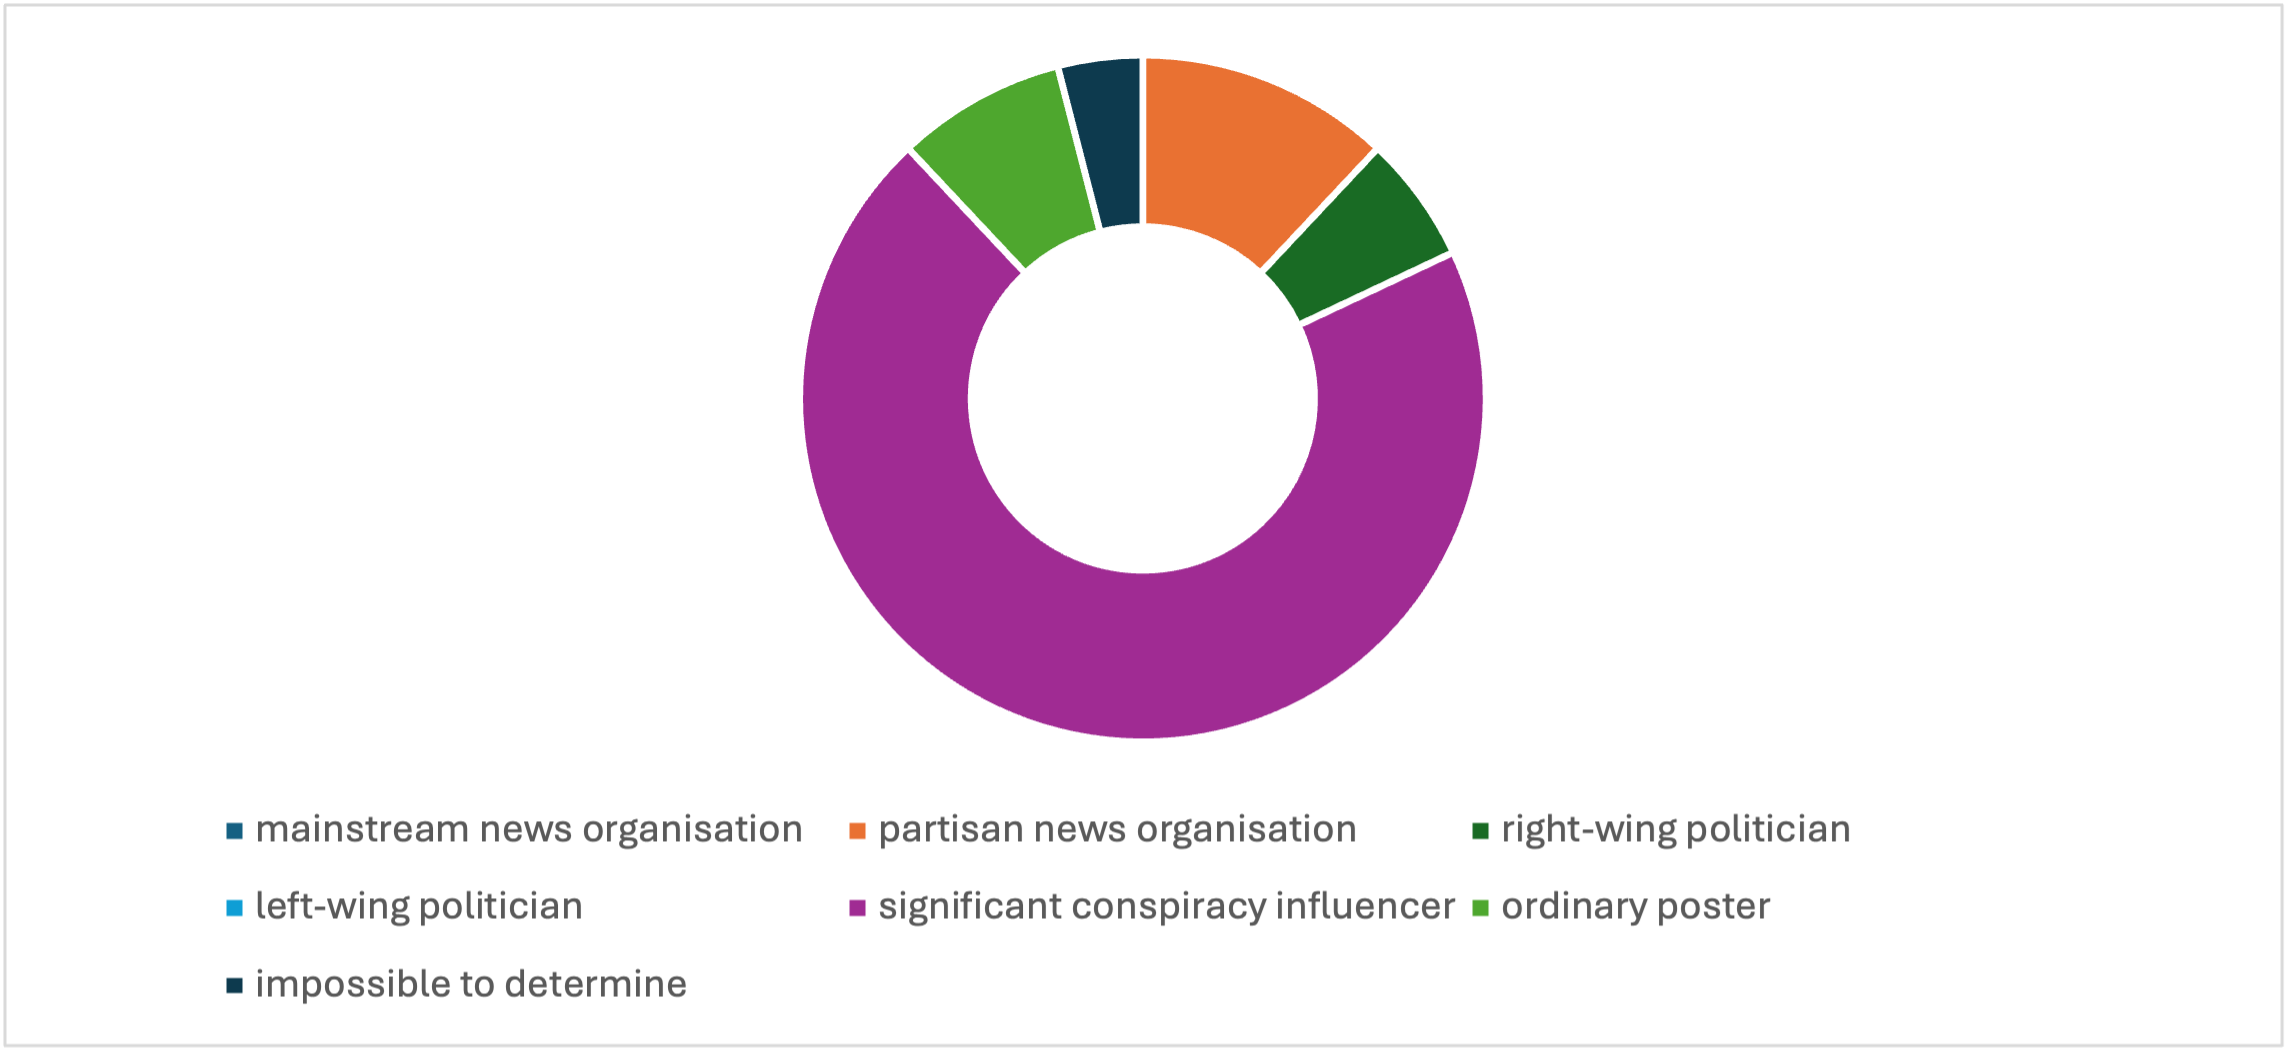
Figure 2.5 Account type distribution for Covid conspiracy theories in the UK on Telegram.
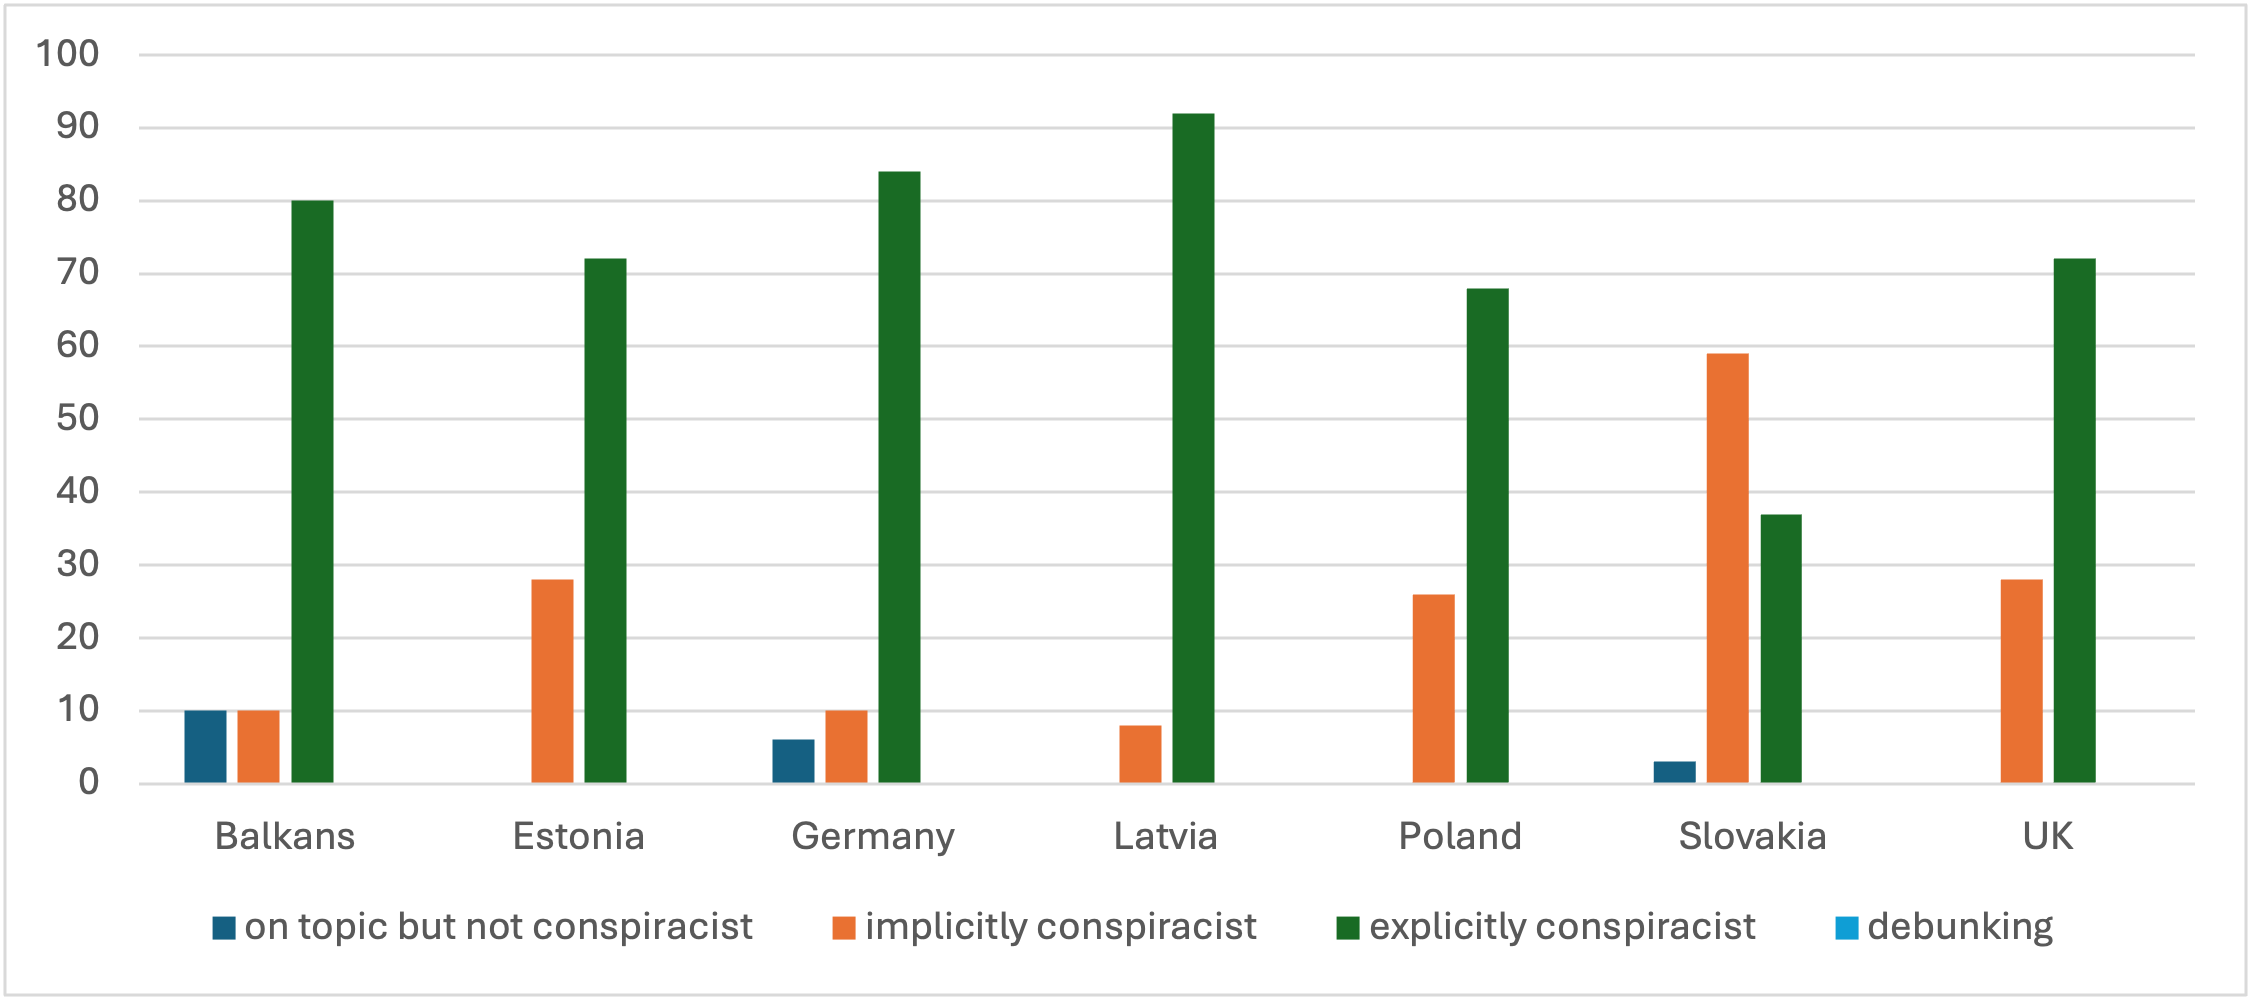
Figure 2.6 Comparison of post type for Covid conspiracy theories on Telegram.
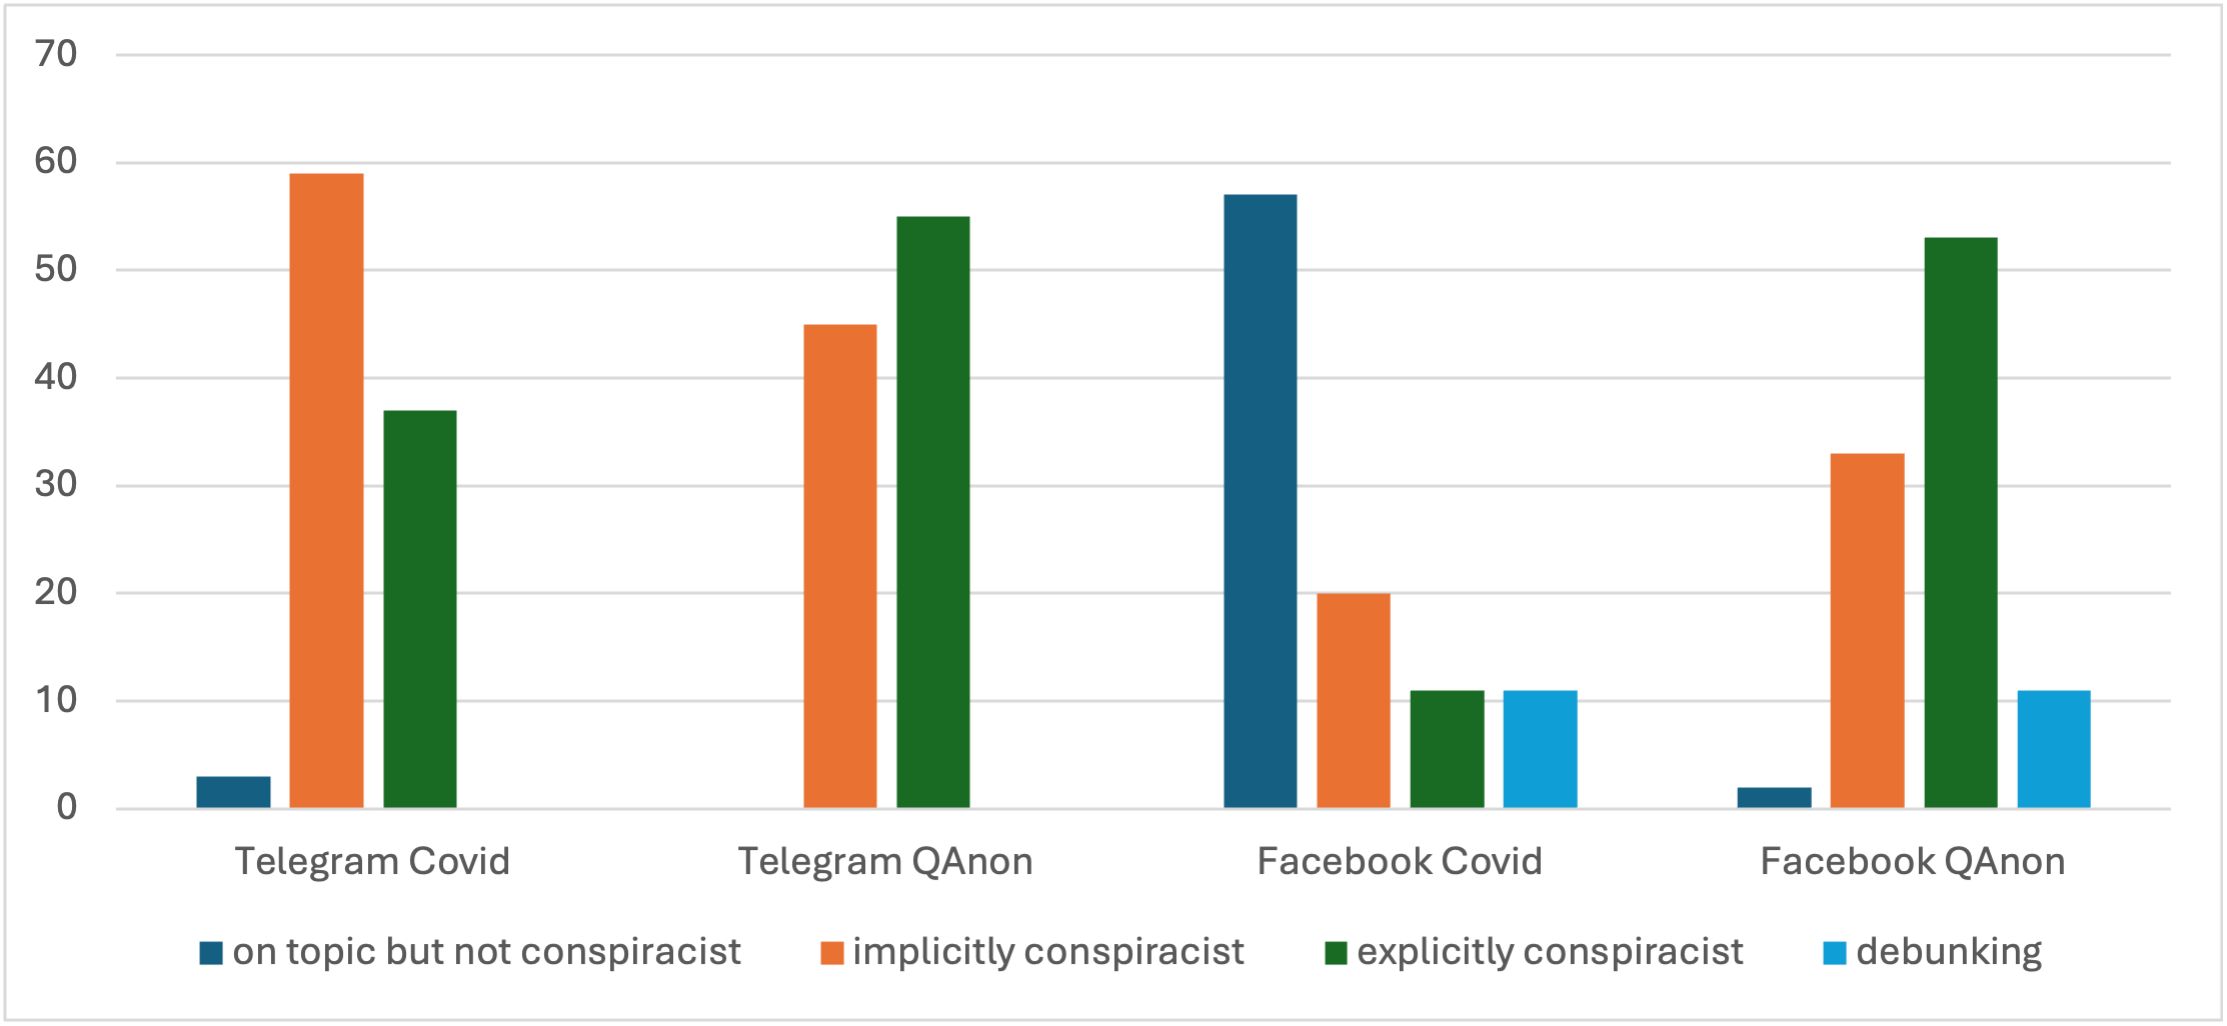
Figure 2.7 Comparison of post type for Covid and QAnon conspiracy theories on Telegram and Facebook in Slovakia.
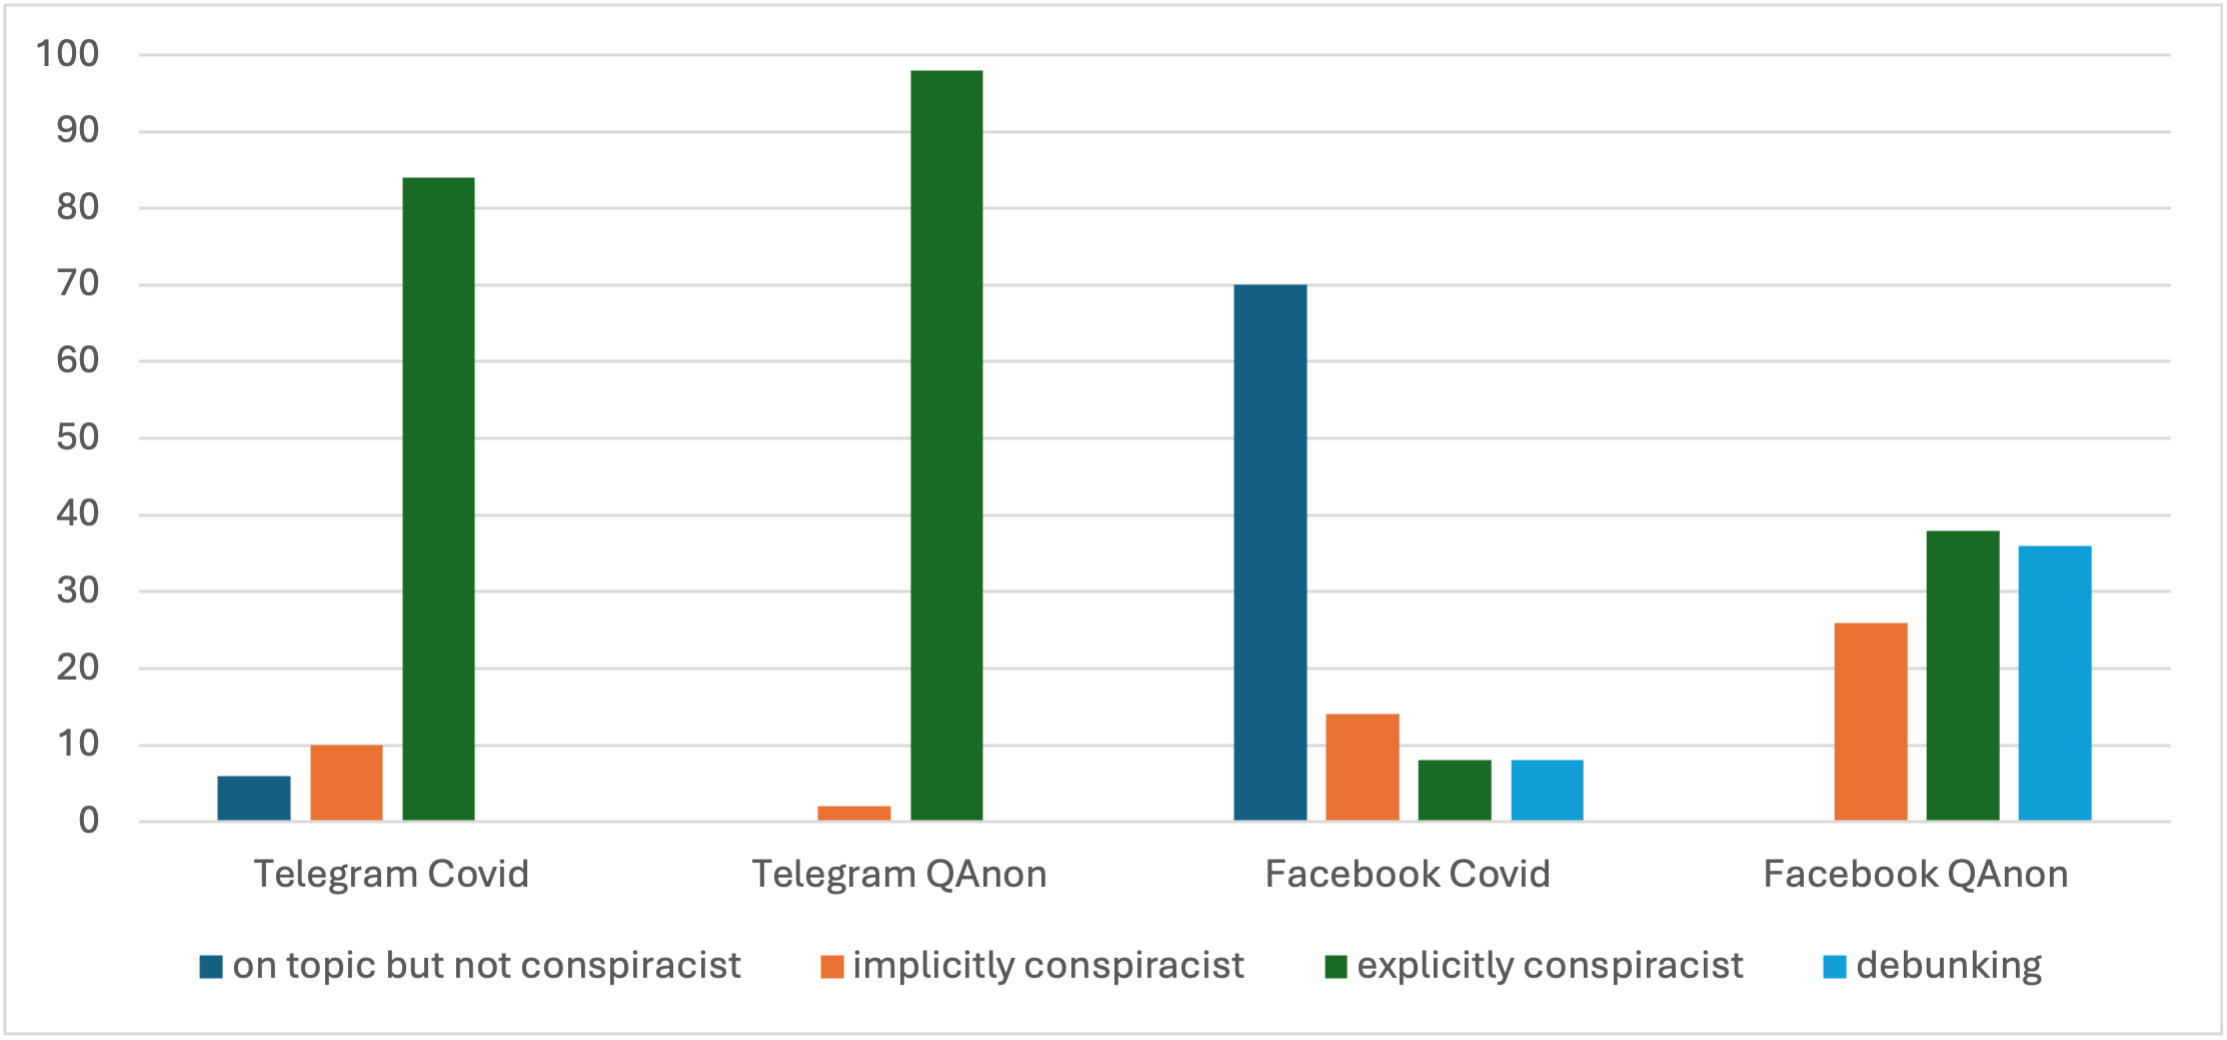
Figure 2.8 Comparison of post type for Covid and QAnon conspiracy theories on Telegram and Facebook in Germany.
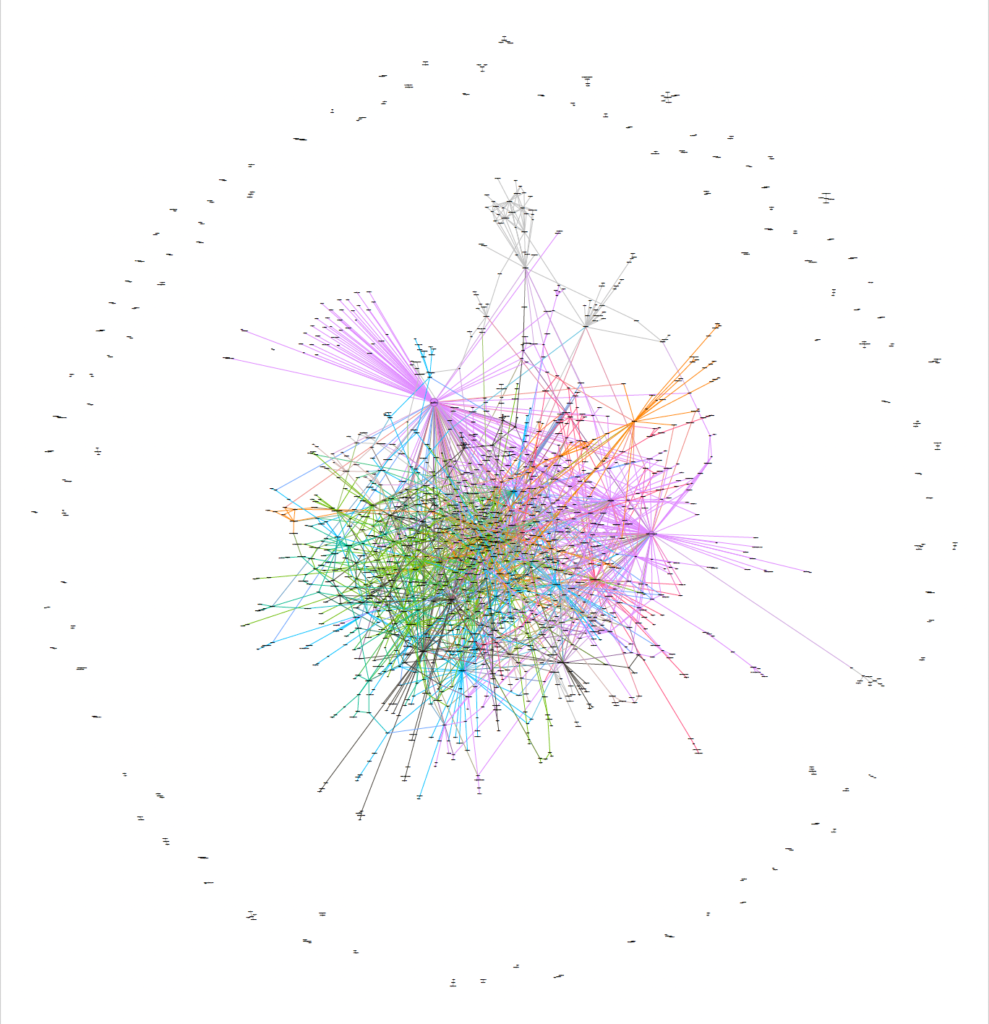
Figure 2.9 Conversation network visualisation of influencer accounts for general conspiracy theories topic on Telegram in Germany.
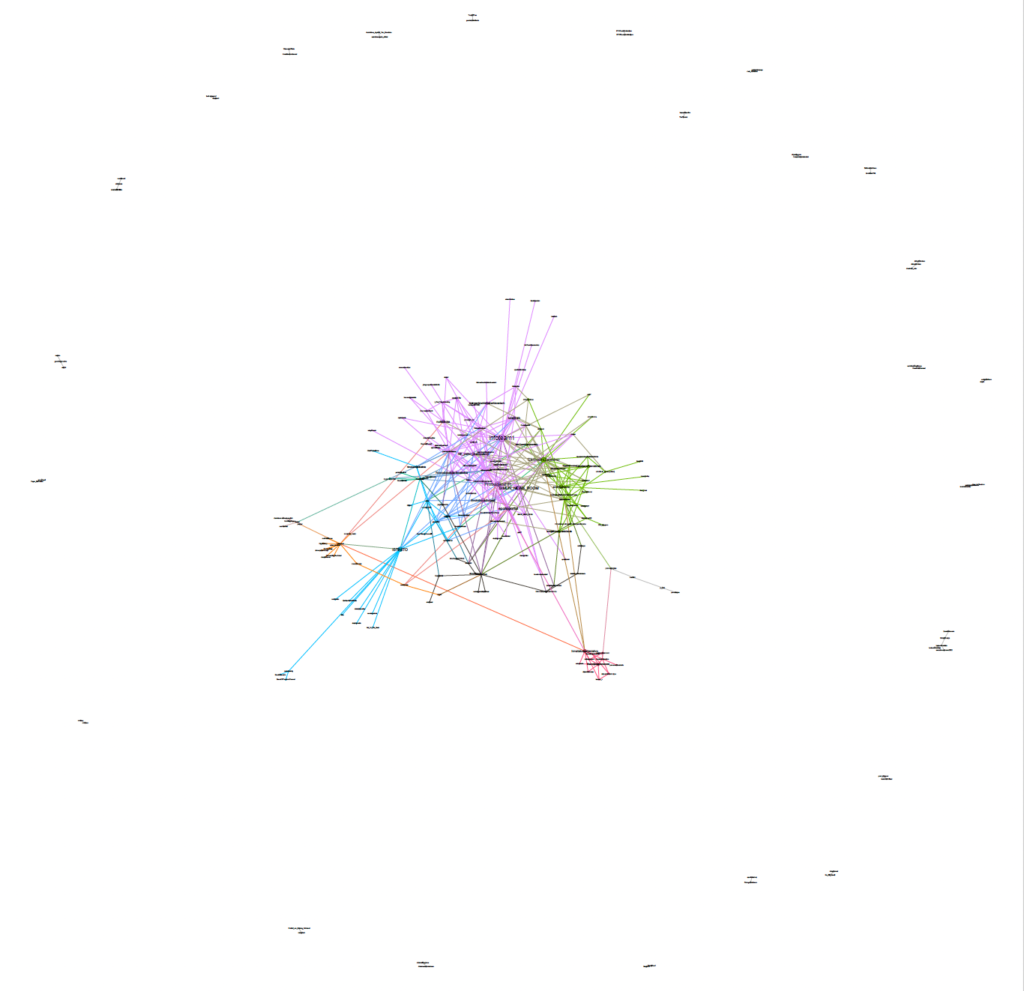
Figure 2.10 Conversation network visualisation of influencer accounts for all topics on Telegram in Croatia.

Figure 2.11 Conversation network visualisation of influencer accounts for QAnon conspiracy theories on Telegram in the UK.
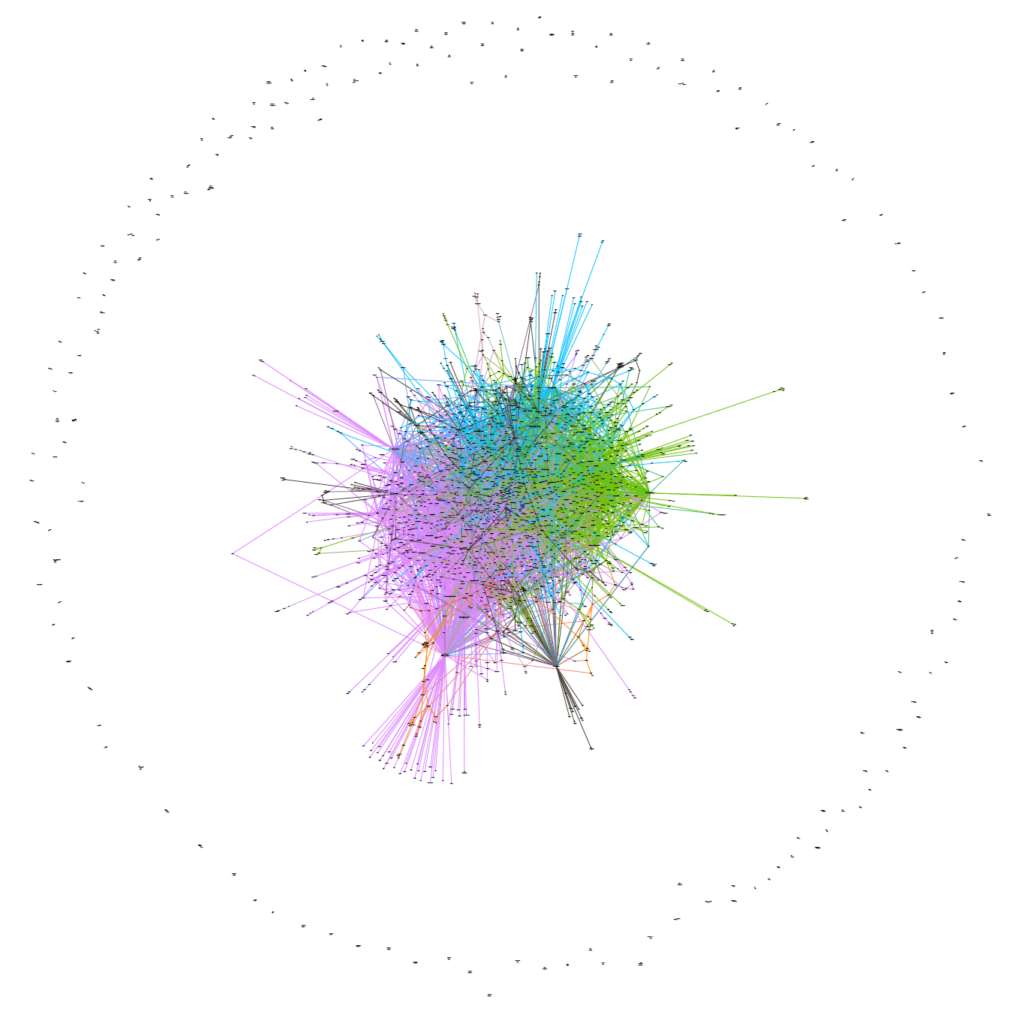
Figure 2.12 Conversation network visualisation of influencer accounts for all topics on combined Telegram dataset in the German-speaking region.
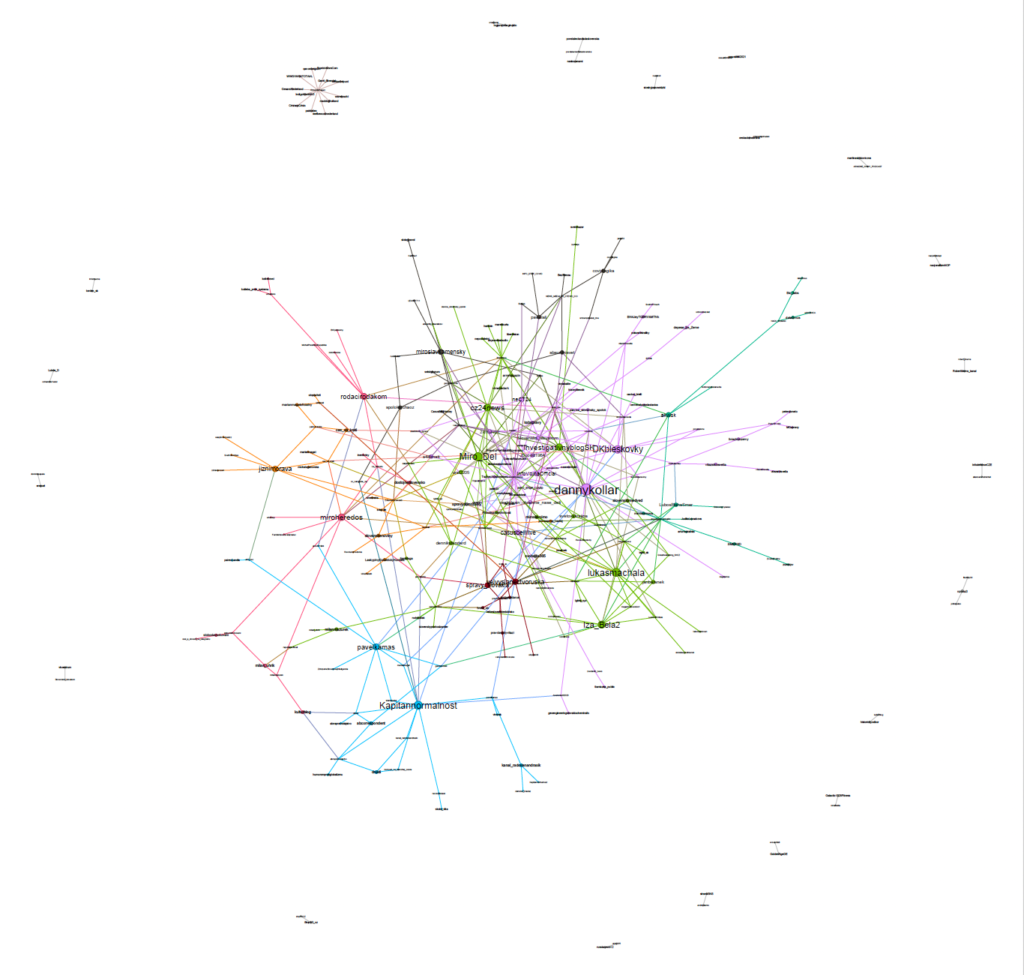
Figure 2.13 Conversation network visualisation of influencer accounts for all topics on combined Telegram dataset for Slovakia.
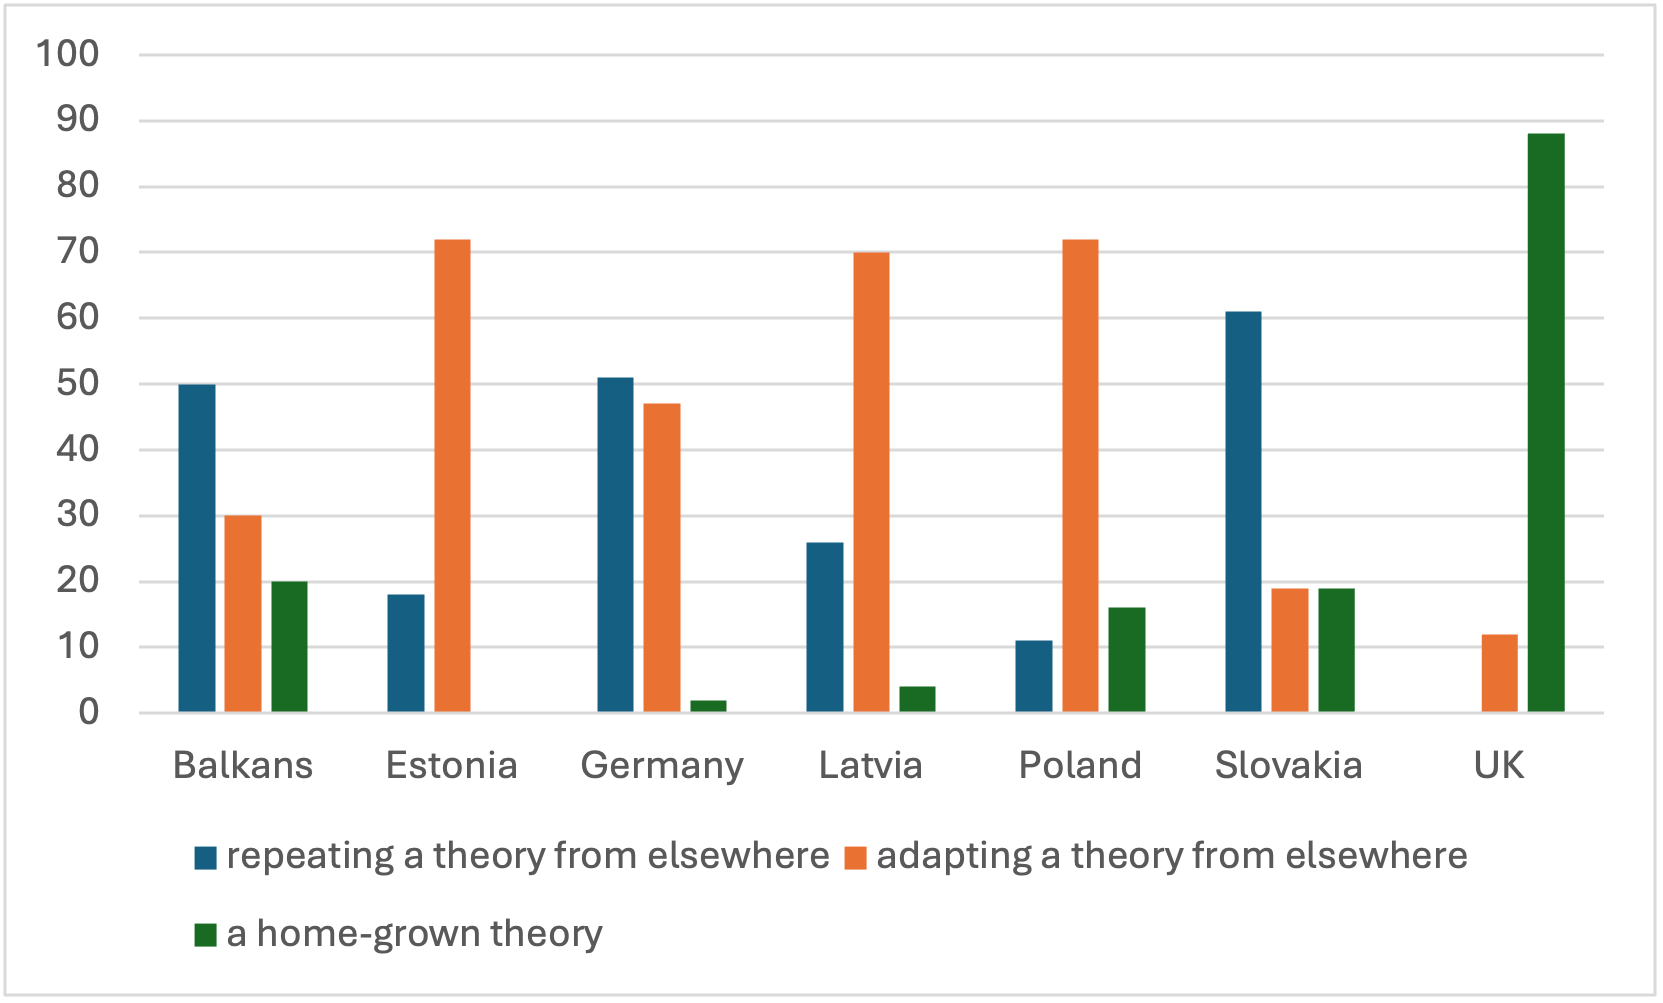
Figure 2.14 Comparison table of source of conspiracy theories about Covid on Telegram.
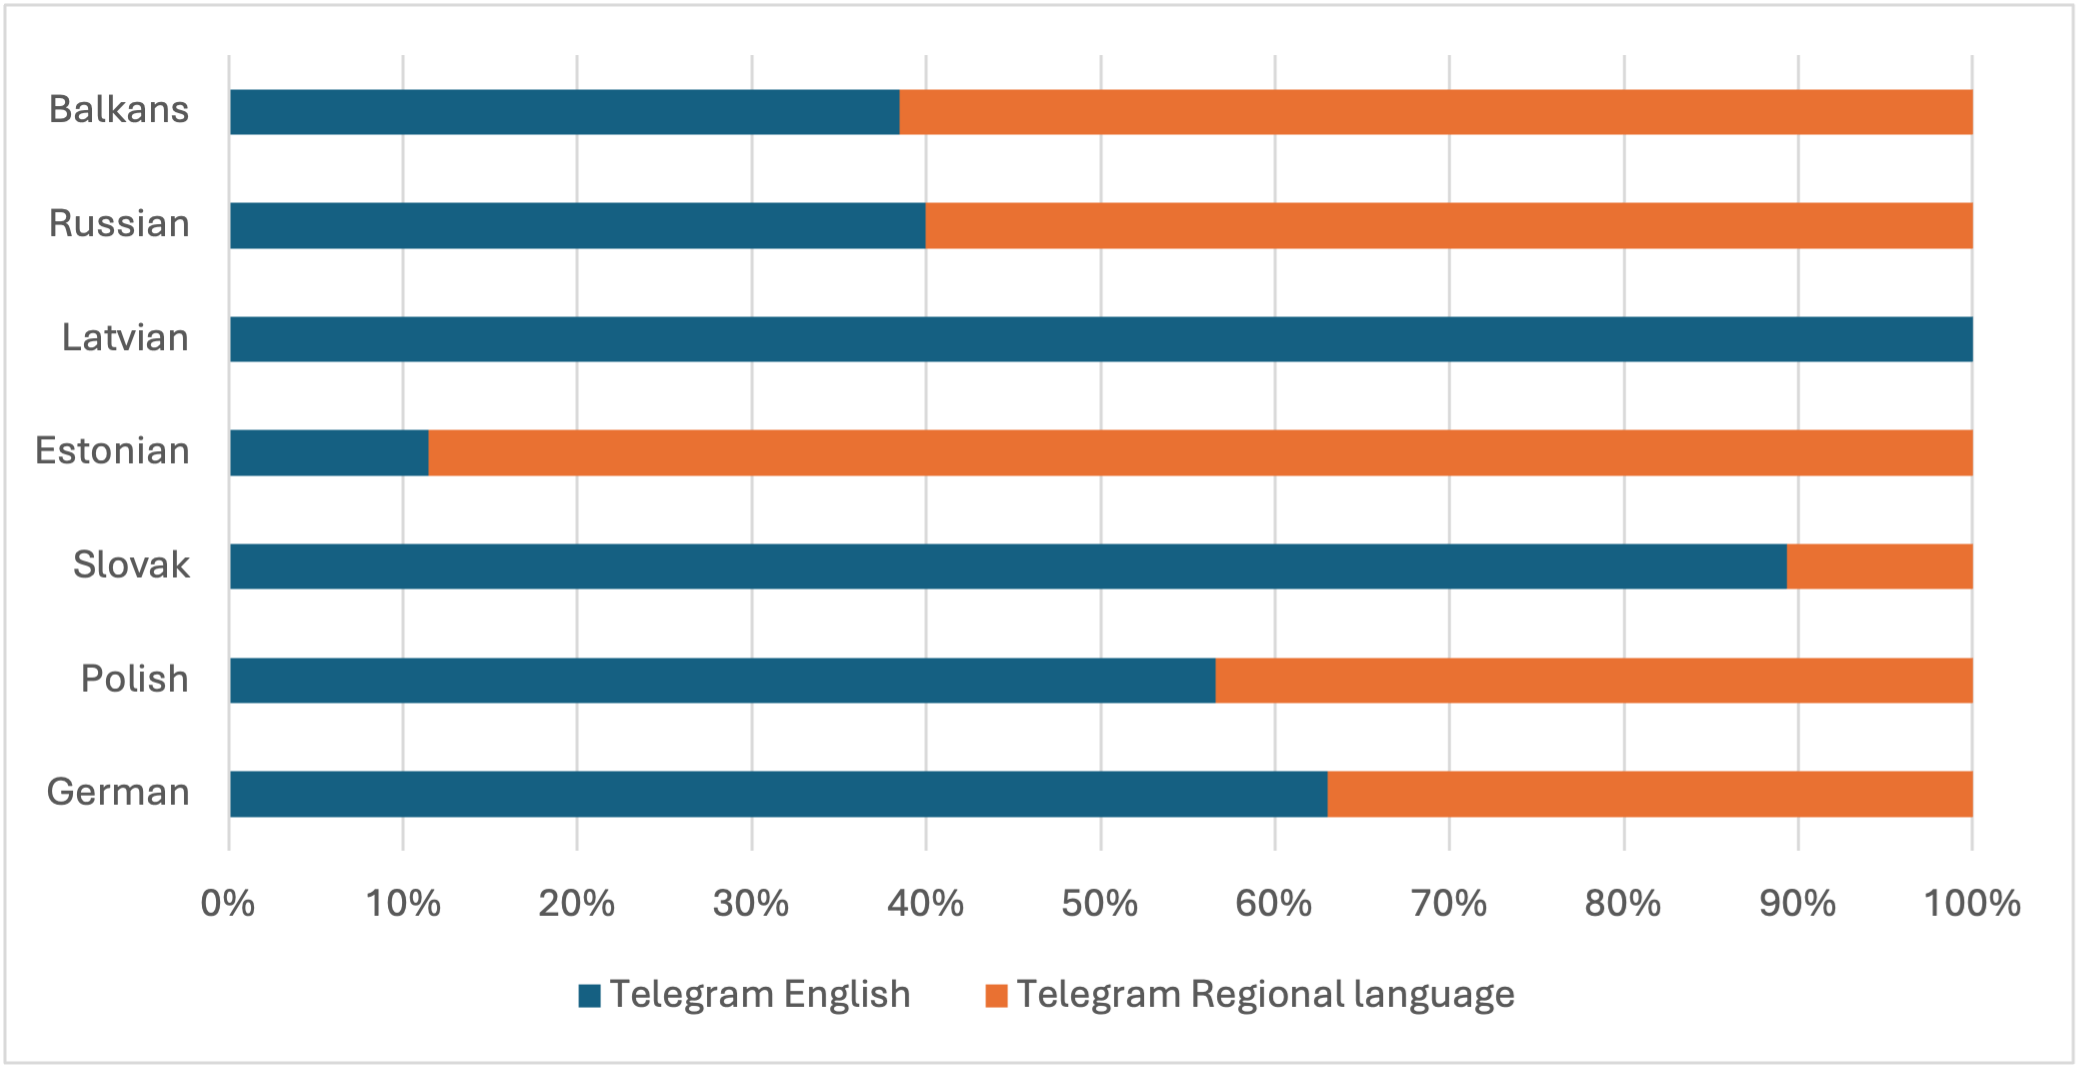
Figure 2.15 Comparison table of local vs English language uses of the term ‘deep state’ on Telegram.

Figure 2.16 Rank-flow diagram showing the changing frequency of the most used words in the UK Telegram dataset for the General topic.

Figure 2.17 Rank-flow diagram showing the changing frequency of the most used words in the German Telegram dataset for the General topic.

Figure 2.18 Rank-flow diagram showing the changing frequency of the most used words in the Slovakia Facebook dataset for the General topic.
Chapter 6: ‘The Goal Is the Unconditional Abolition of Cash’: German-language Conspiracy Theories about the Ban on Cash and Expropriation

Figure 6.1 Number of Twitter/X posts on ‘finance’ over time
Figure 6.2 Co-occurring words in the Twitter/X dataset ‘finance’

Figure 6.3 Number of Telegram posts on ‘finance’ over time

Figure 6.4 The most important producers of content in the Telegram dataset ‘finance’
Chapter 8: Conspiracy Culture Wars: 15-Minute City Conspiracy Theories in the UK
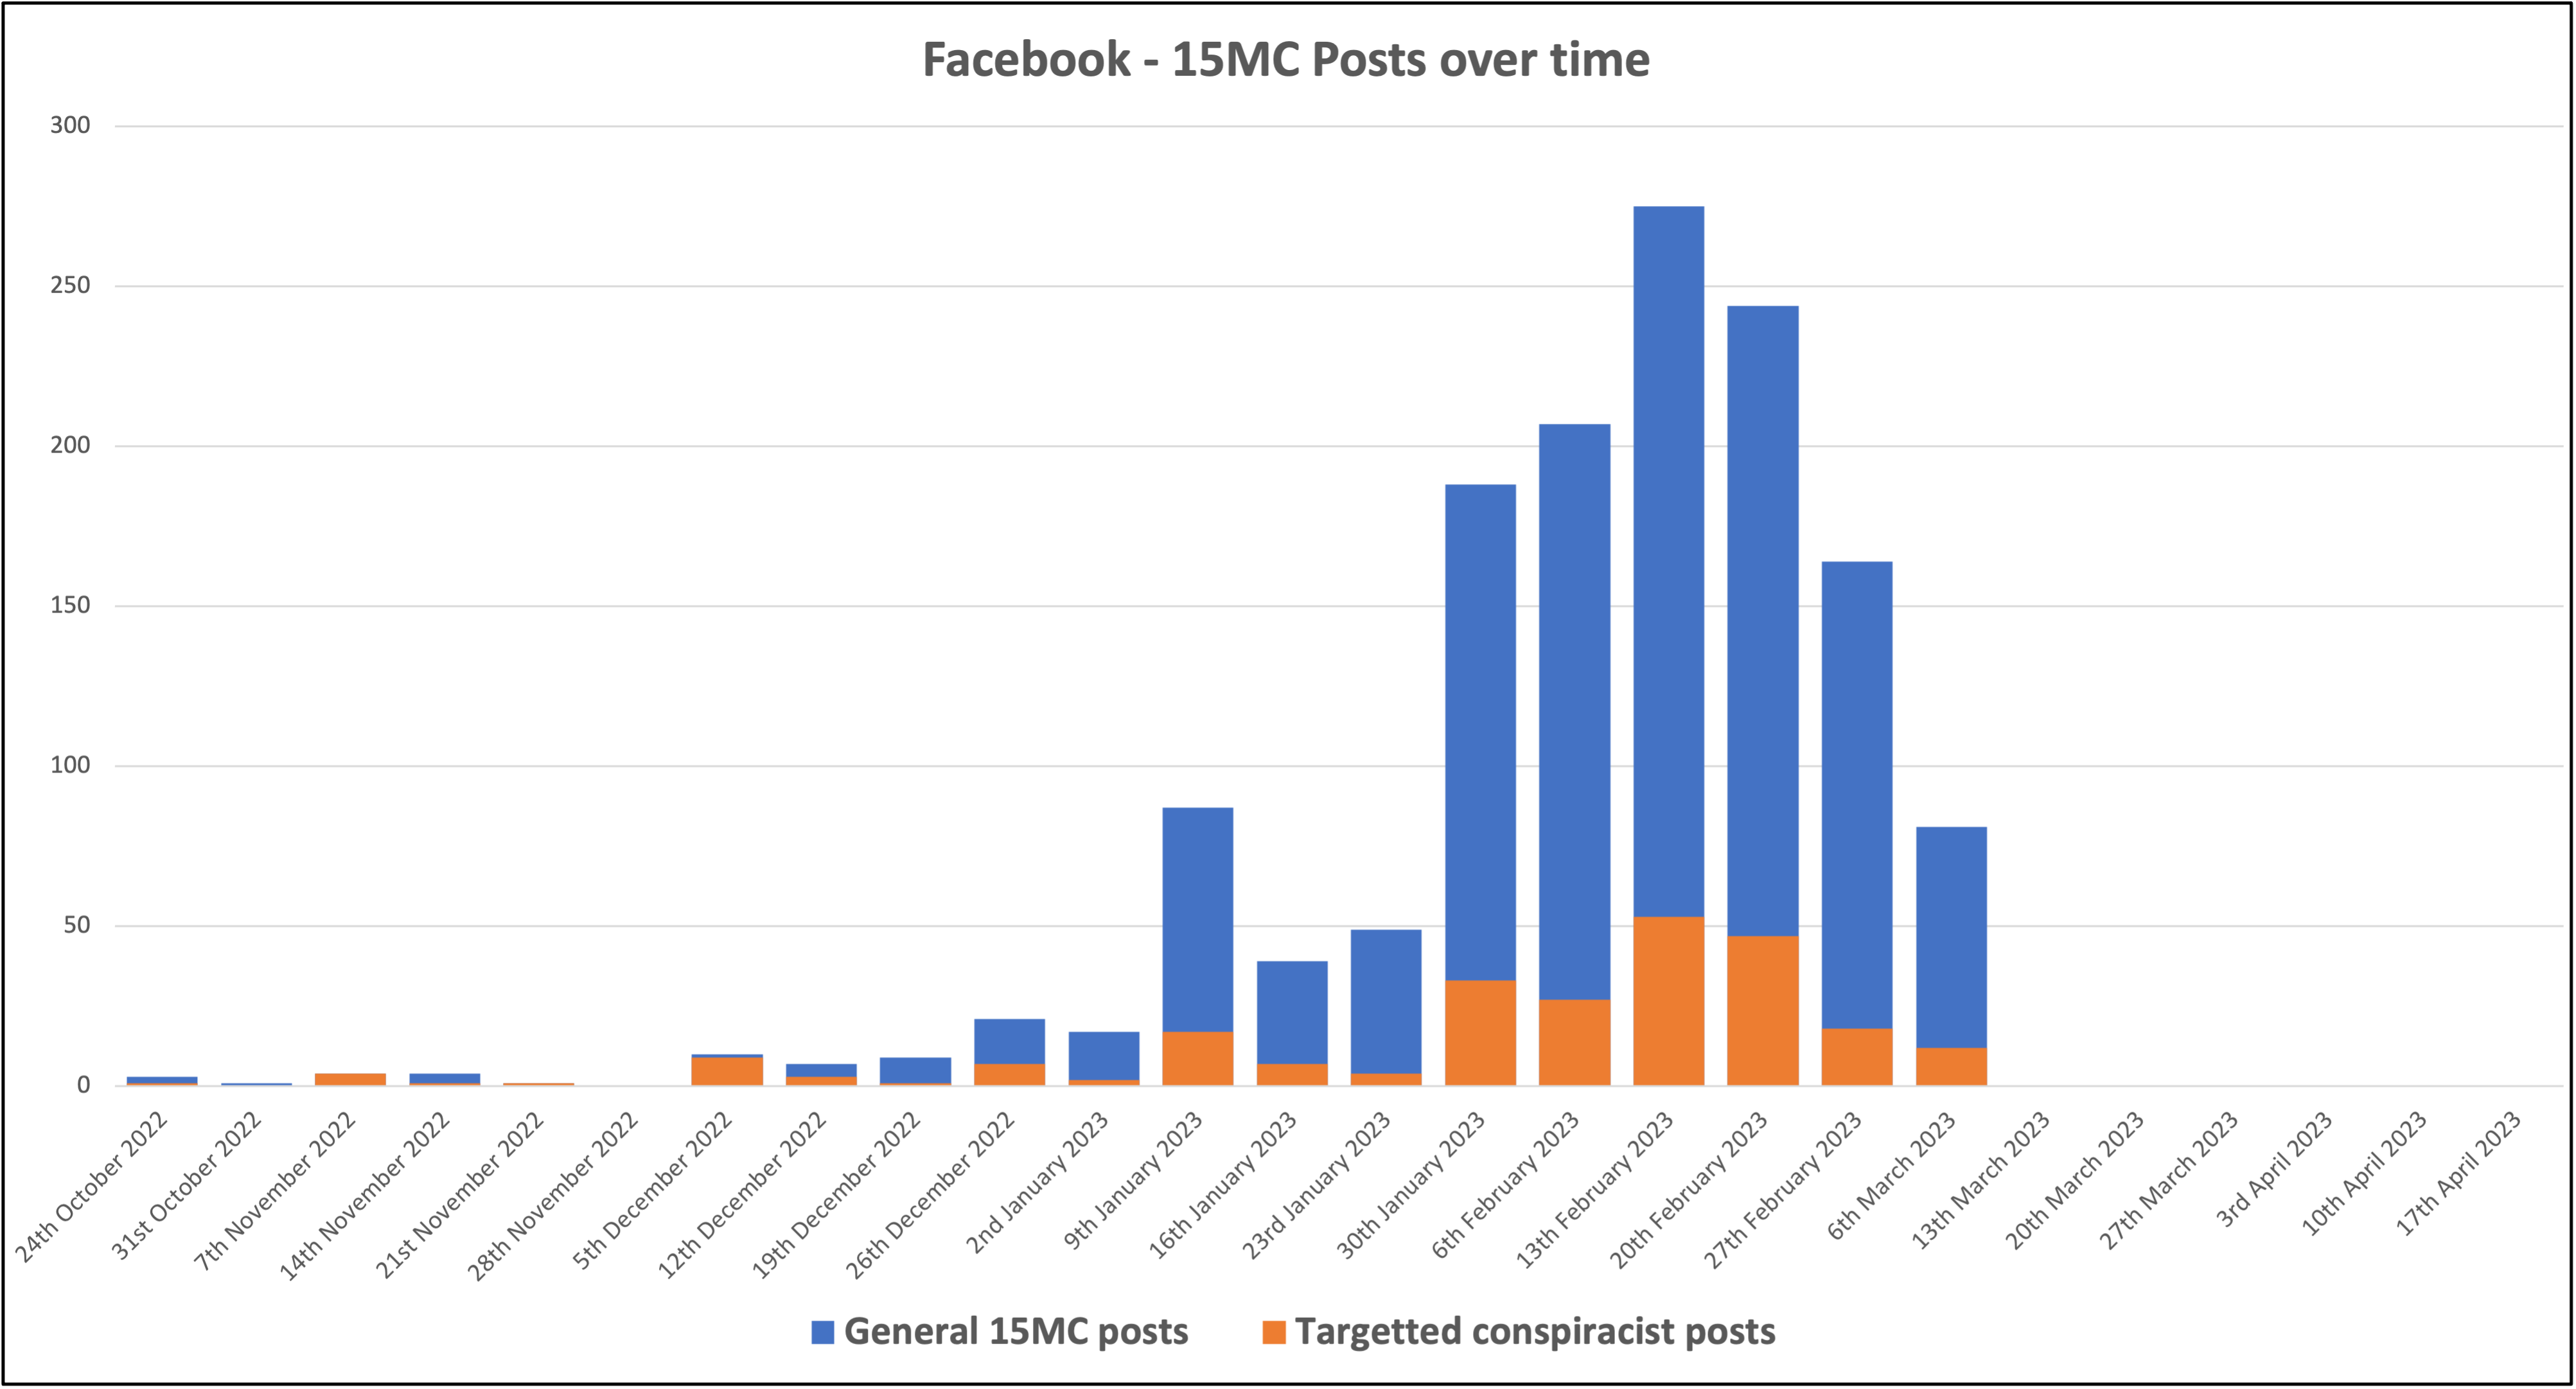
Figure 8.1 A chart showing the number of posts mentioning the term ‘15-minute city’ in both the ‘general’ and ‘targeted’ Facebook datasets, 2022-2023.
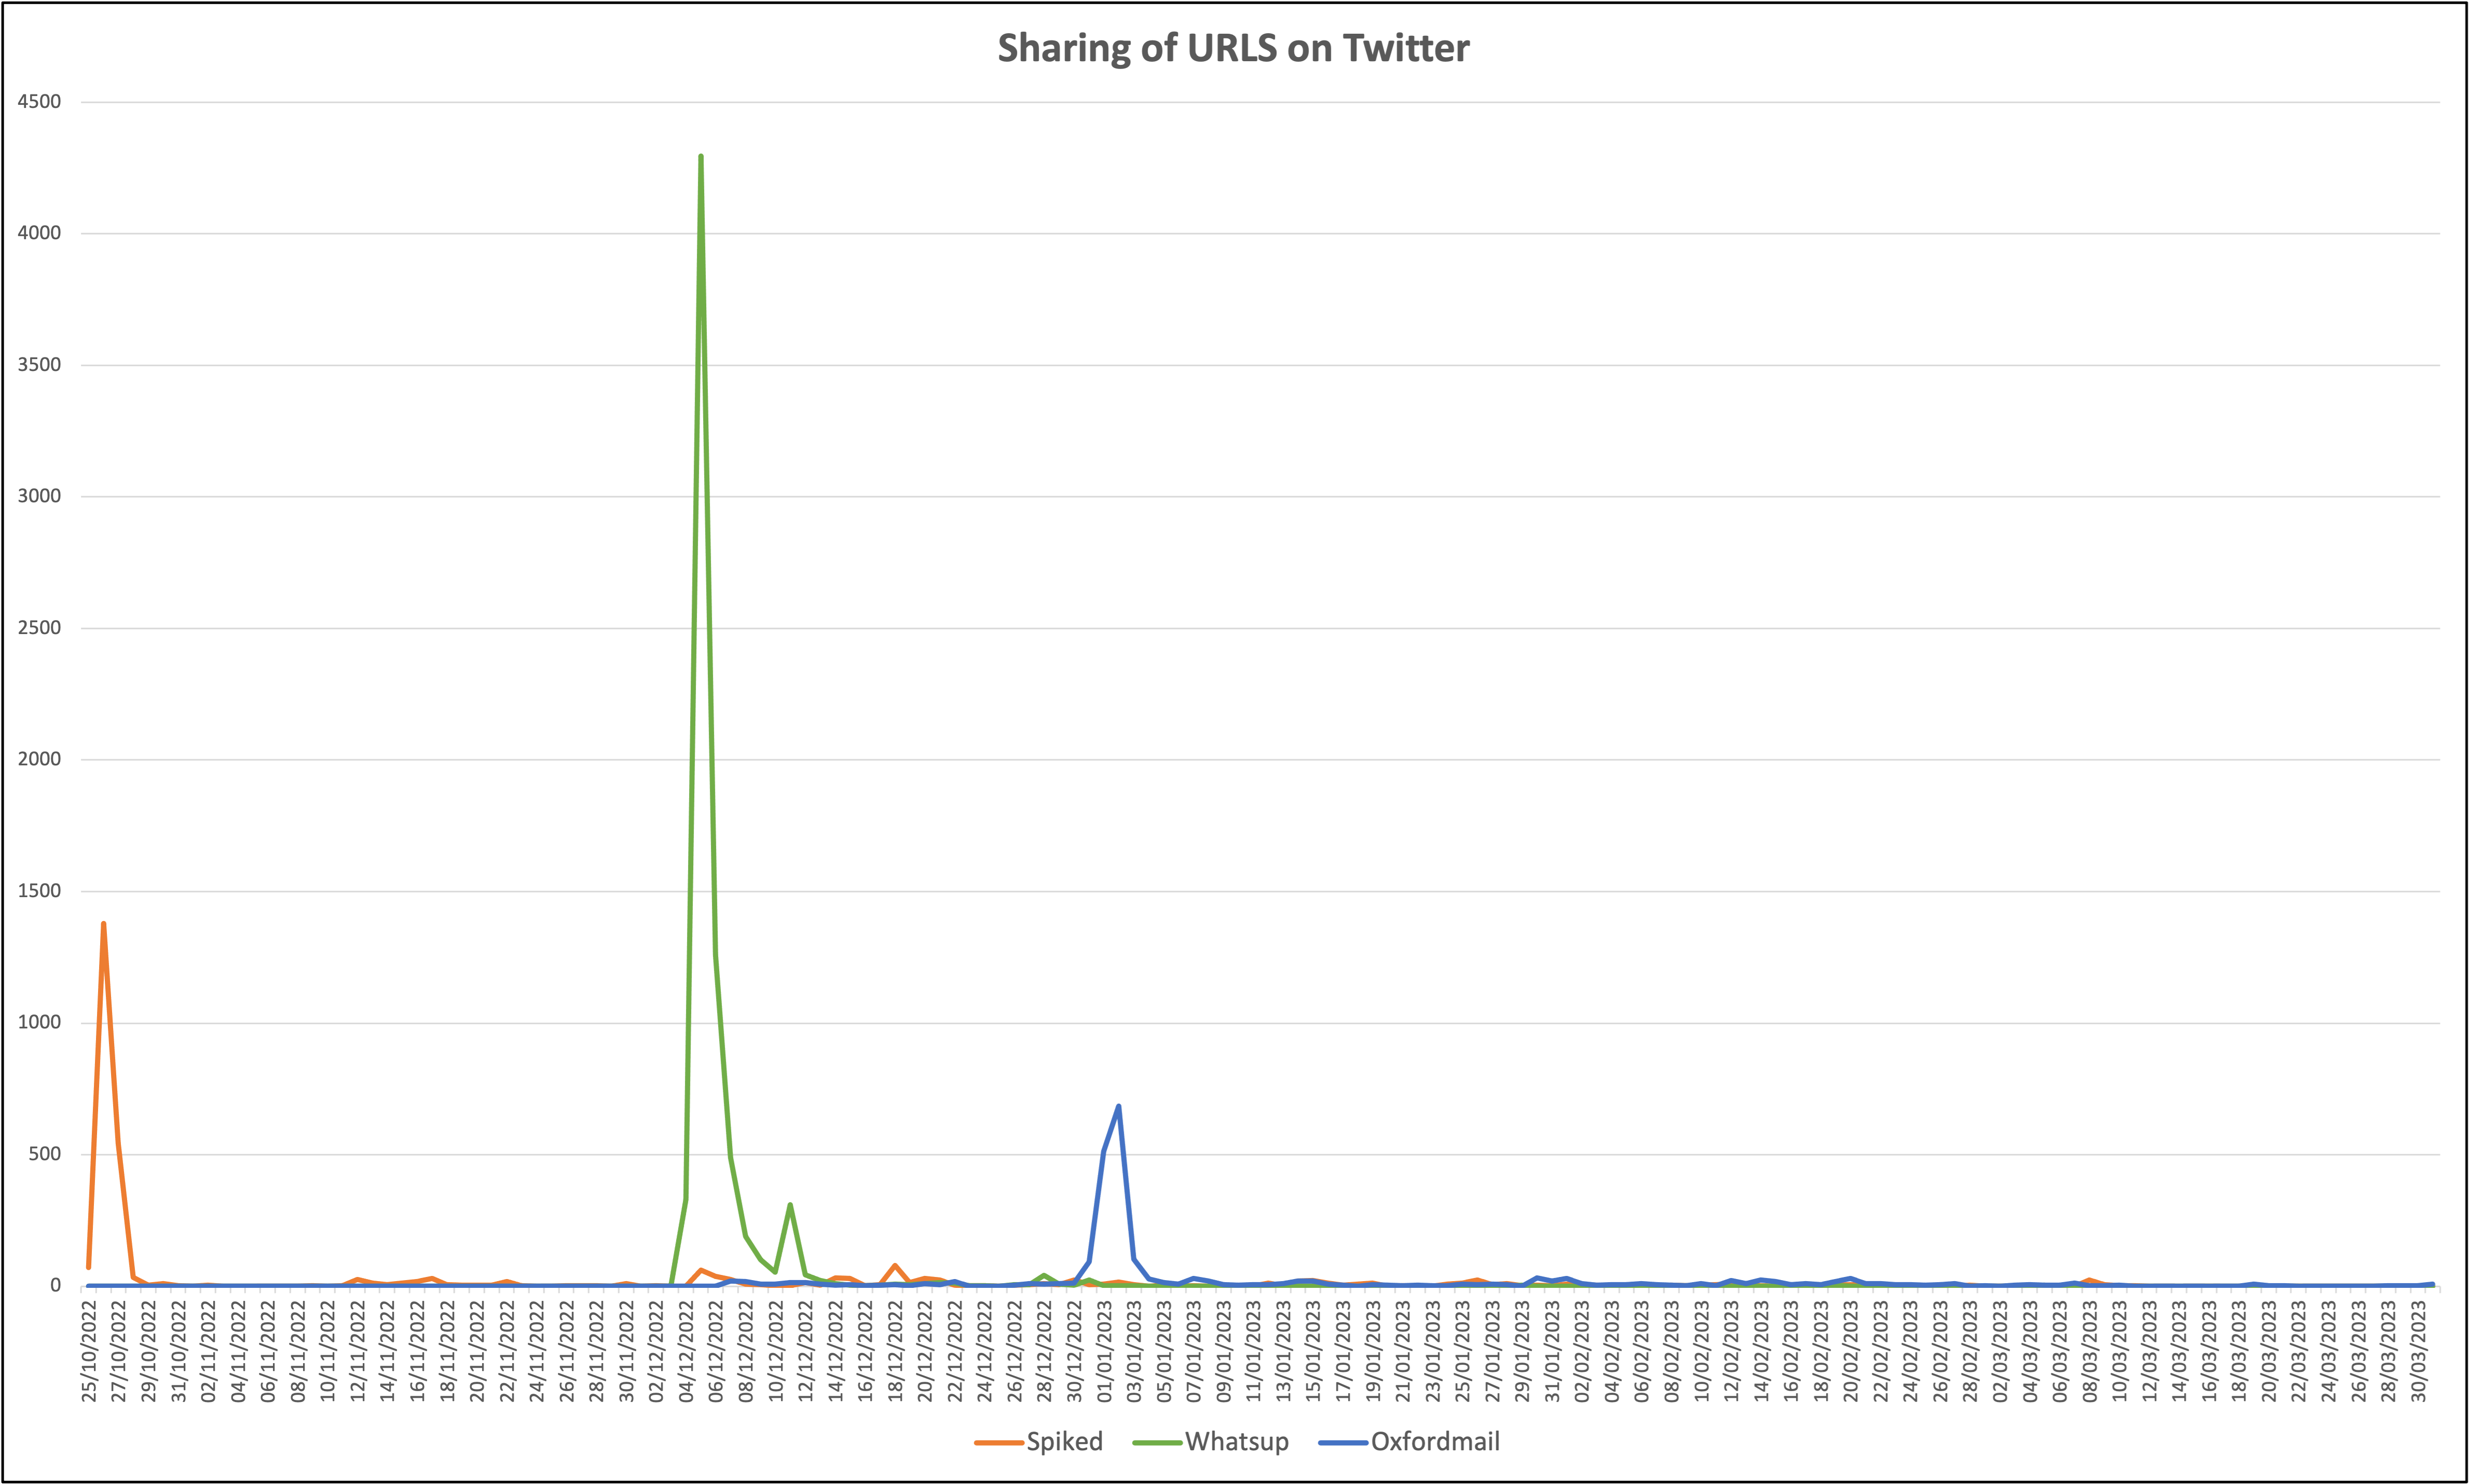
Figure 8.2 A graph showing the number of posts in our dataset linking to the articles on 15-minute cities in Spiked Online, the Oxford Mail and ‘Watts Up With That?’ on Twitter, 2022–2023.
[YouTube Video] Figure 8.3 An animation of social network visualisation of accounts posting about 15-minute cities on Twitter between November 2022 and April 2023.
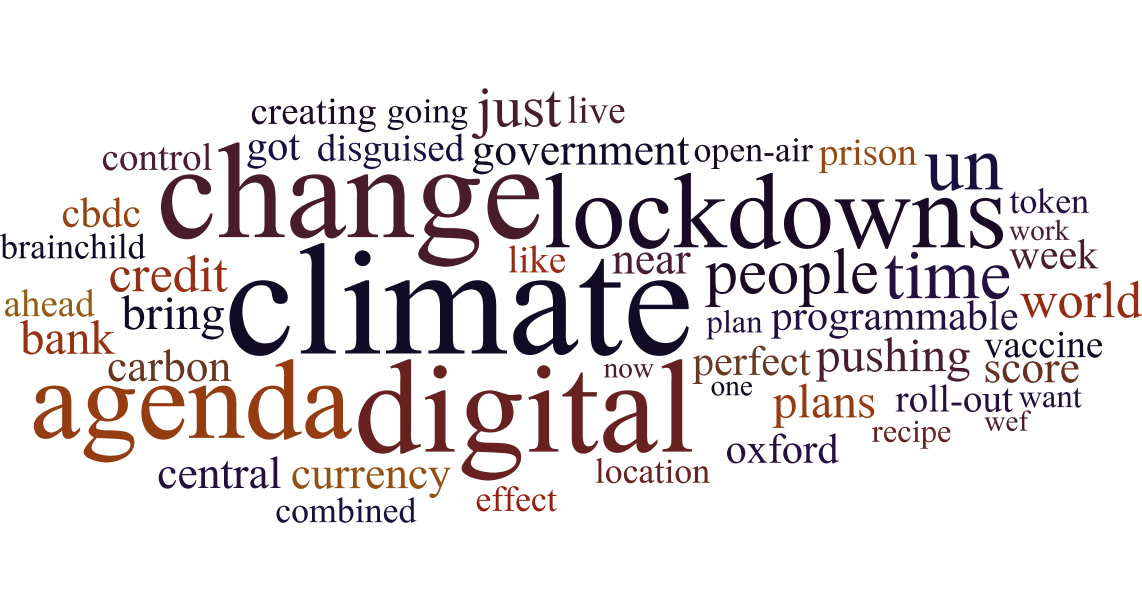
Figure 8.4 A word cloud generated from the targeted Instagram dataset.
Figure 8.5 A rank-flow diagram of the top 15 keywords from the targeted Facebook dataset.